Google released Gemini 4 Neon on November 18th. Benchmark charts are useful as a starting point, but the question I actually care about is much narrower: when a model has to build working software on Aster (reading the data, writing the app, checking it, and publishing it), how well does it do and what does it cost?
So we ran a test across six models... two each from Google, Anthropic, and OpenAI. Every model got the exact same prompt to build the exact same app. Then we measured each build, tested every app in a browser, and had all six graded blind.
I've split this post into three parts: what we measured, what the blind grader judged, and what I actually think about the results (saving my opinions for Part 3).
Let's walk through how we set it up.
The Task
The app we asked each model to build is a scenario model. Each item gets its own inputs, a set of sliders shifts everything at once, the numbers recompute live, charts show the result, and people can save a scenario and compare two of them side by side. Our customers ask for this kind of app all the time, whether it's a landscaping company pricing next season's jobs, an elevator service company planning maintenance, or a fund modeling exits.
For this test, we used the fund version. Meridian Capital is a demo private equity firm we keep in Aster for testing. Its companies and numbers are synthetic, but they live in Aster the same way a real customer's data would: structured tables alongside a library of quarterly reports.
Here's the exact prompt every model received (the only thing that changed between runs was putting the model's name in the app title):
Build me an app called "Fund III Exit Lab". It's for a Meridian partner meeting, so make it look premium and feel fast.
Use our real data: the Company Master, Deal Log and Portfolio KPIs data stores, plus the Portfolio Company Financials knowledge base if you need more. Don't invent numbers. If something's missing, show it as missing.
What it should do:
- For each Fund III portfolio company: what we paid (entry valuation or multiple, and date) and where it is now (latest revenue, EBITDA, growth).
- Let me set an exit multiple and exit year per company, plus fund-wide sliders that shift every company at once, and recompute each company's MOIC and IRR and the fund's gross TVPI live.
- A chart of projected exit value by company, and a ranked view of where the value creation comes from.
- Let partners save a named scenario and compare two scenarios side by side.
When it's done, give me the link and a short note on any data gaps.
There's one gap in the data that really matters here: none of it records what the fund paid for any company. A model that wants to hit every bullet in the prompt has a reason to make up entry prices, even though the prompt explicitly tells it not to.
The Setup
Each model got its own copy of the same Aster agent... same instructions, same tools, with only the model swapped out. Each one ran at its default reasoning setting in Aster, and every build ran once on production with no help after the initial prompt.
We paired the models by the tier they fill in Aster:
| Tier | Anthropic | OpenAI | |
|---|---|---|---|
| Standard | Gemini 4 Neon | Claude Sonnet 5.5 | GPT-6.2 Sol |
| Premium | Gemini 4 Carbon | Claude Opus 5.5 | GPT-6.2 Astra |
Part 1: What We Measured
The numbers below come straight from Aster's records of each build, with costs calculated using each provider's list price.
| Model | Build time | Tool calls | Input tokens | Output tokens | Cost |
|---|---|---|---|---|---|
| Gemini 4 Neon | 15.4 min | 60 | 3.2M | 81K | $2.89 |
| Claude Sonnet 5.5 | 10.2 min | 41 | 2.9M | 69K | $1.94 |
| GPT-6.2 Sol | 8.0 min | 57 | 2.0M | 23K | $0.86 |
| Gemini 4 Carbon | 20.3 min | 58 | 2.6M | 94K | $5.15 |
| Claude Opus 5.5 | 18.3 min | 64 | 7.5M | 102K | $7.30 |
| GPT-6.2 Astra | 5.4 min | 47 | 1.4M | 10K | $2.24 |
Note: Google has Gemini 4 Carbon on an introductory price through November 30th, which makes this build $2.58 today. The table above uses the $5.15 list price it will cost after that.
Once the builds finished, we tested every app in a browser using the same checks across all six:
- All six apps worked: Moving the fund-wide slider updated the headline numbers in every app.
- All six got the data right: We checked the same facts in each app (one company's revenue, EBITDA, debt, and entry date), and every app had them.
- None of the six invented an entry price: Every app showed entry price as missing and gave partners a way to enter it. Carbon also offers a clearly labeled "illustrative" range.
- Three apps had tables too wide for a laptop screen: At 1440 pixels, Neon, Carbon, and Opus each had a table cut off on the right. Sol, Sonnet, and Astra all fit.
- They handled fund TVPI in two different ways: Neon and Carbon calculated it against the fund's full cost (which includes a credit book that none of the data describes), and said so in the app. The other four left it blank until someone enters the missing input.
Part 2: What the Blind Grader Judged
Measurements alone can't tell you whether an app is actually good to use, so we had each one graded blind.
The grader saw screenshots of every tab with the model names removed from the page and each app labeled only with a random letter, then scored each app against a checklist we wrote before any of the builds ran. Functionality covers the eleven requirements from the prompt, and polish covers five items scored out of five (for 25 points total).
| Model | Functionality (of 11) | Polish (of 25) | Grader's ranking |
|---|---|---|---|
| Gemini 4 Neon | 11 | 19 | 1 |
| Claude Opus 5.5 | 11 | 20 | 2 |
| Gemini 4 Carbon | 11 | 17 | 3 |
| GPT-6.2 Astra | 10.5 | 20 | 4 |
| Claude Sonnet 5.5 | 10 | 20 | 5 |
| GPT-6.2 Sol | 10 | 18 | 6 |
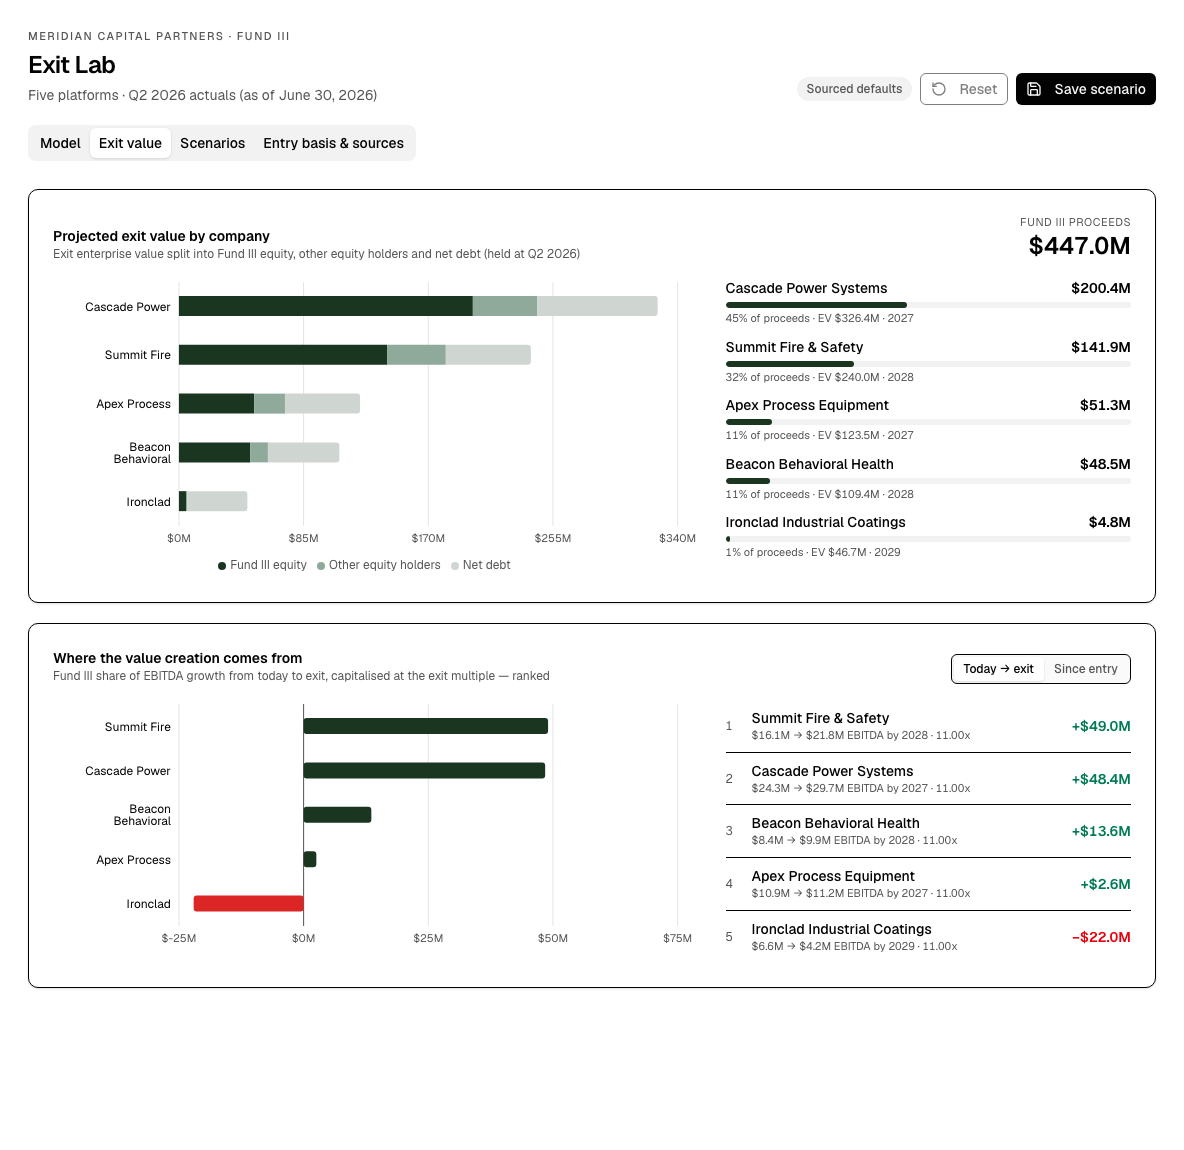
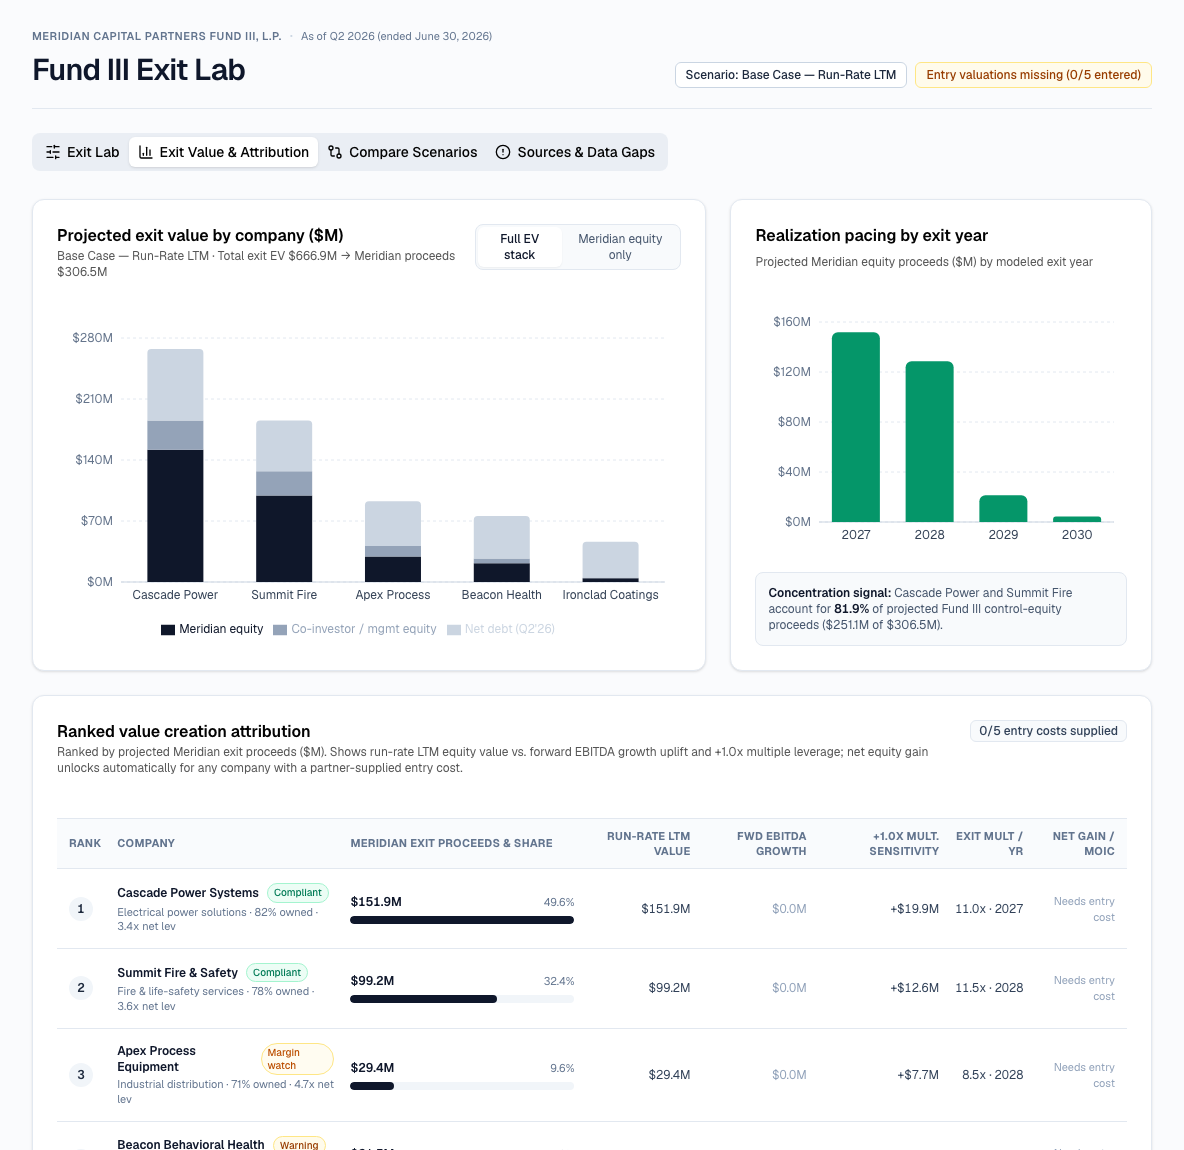
The grader put Neon first because its scenario comparison was the only one that showed a meaningful difference the moment you opened it. Opus came in second for having the best charts in the group.
Here's Opus's exit value tab:
And here's Neon's version of that same view:
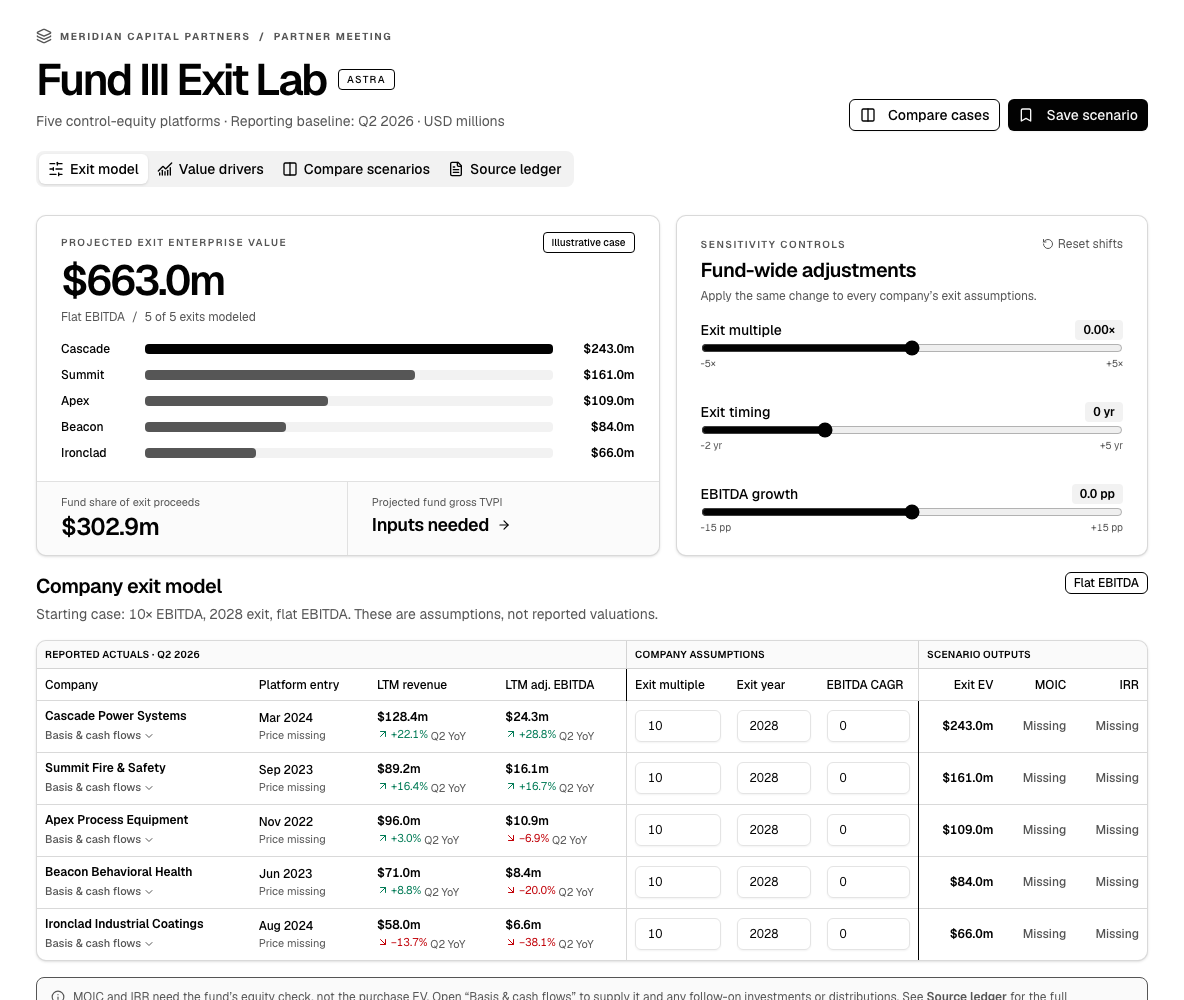
The grader also called Astra's opening screen the clearest of the six:
Part 3: What I Think
Ok, now that we've gone through the numbers and the blind grading, here's my read on what stood out.
Price and depth moved together
Sol built a working app for 86 cents. Opus spent $7.30 on the exact same prompt (about 8.5 times as much). Across the six builds, the three most expensive ones (Opus, Carbon, and Neon) went deeper... more charts, fuller breakdowns of where the value comes from, and more detail per company. The three cheapest builds (Sol, Sonnet, and Astra) stayed simpler, and they were also the only apps whose tables fit on a laptop screen.
Neon was the best value for us
Neon tied for the most complete app, took first place with the grader, and cost about 40% of what Opus did. Neon is now the default standard model for Aster organizations that choose Google.
Opus read a lot
Opus used 7.5 million input tokens, which is more than twice any other model in the test. Most of that came from cache, so it cost less than that number makes it sound, but it still ended up as the most expensive build.
Every model left the missing numbers blank
This is the result I care most about. In client work, a confident wrong number is worse than a gap, and all six models handled the missing entry prices the same way by leaving them blank instead of making them up. Even on fund TVPI (where Neon and Carbon calculated against the fund's full cost and noted the caveat, while the other four left it blank), both approaches are defensible.
What This Doesn't Tell You
Before you read too much into any one ranking here, there are a few important caveats to keep in mind:
- Each model only built the app once: A second run could change any of the close results.
- Claude was the grader and also ran the test harness: Two of the six contestants are Anthropic models. Even with the model names stripped out of the screenshots, that doesn't remove a shared sense of what looks good. Anthropic's models finished second and fifth, though you should still weigh that.
- Carbon ran at medium reasoning: That's its default setting in Aster, whereas the other five models ran at high.
- The screenshots only show each app as it first opens: Apps that start from flat assumptions look emptier until you move a slider.
- The data is synthetic: Meridian is a demo company we keep in Aster for testing.
- Prices change: Carbon's price doubles on December 1st once the introductory period ends.
What's Next
We kept everything from this run: the prompt, the build records, the browser checks, the grader's full report, and every screenshot. We'll run the same test each time a major model ships, and we'll add other kinds of work too, like building agents and extracting data from documents.
If there's a model or a task you'd like us to test, let me know.